Deyaar
- February 27, 2022
- Stock Stalker
- 2

Deyaar's Financial Results Helping
Friday Deyaar released their financial results and market reacted positively. From here we have 2 important information’s.
- Deyaar is trying to clear the losses in their balance sheet.
- Update on Limitless issue.
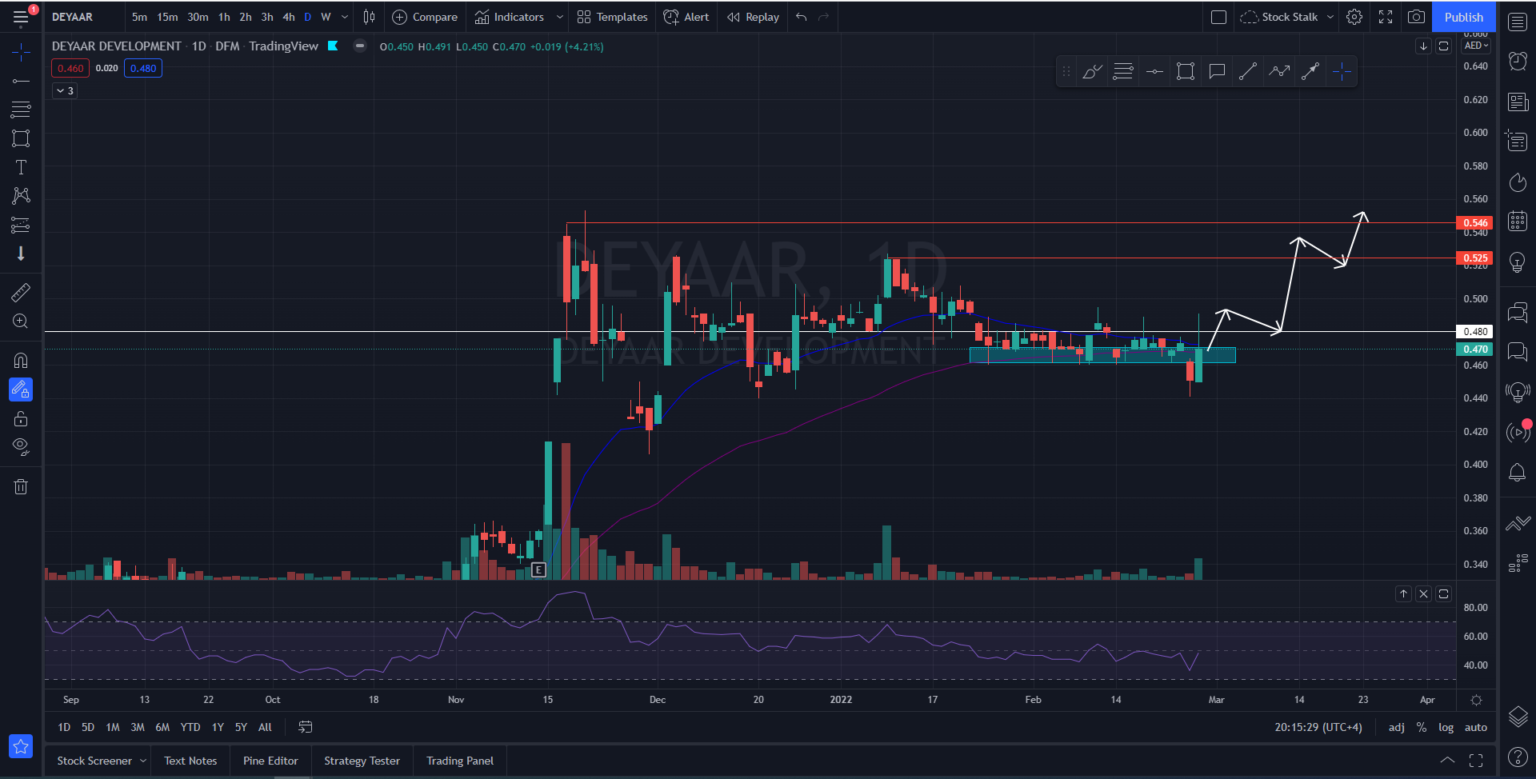
If you are following my trade ideas regularly I have been mentioning that 0.460 – 04.70 level is very weak as its been tested multiple time within a short time frame. This level as of now is also coinciding with 20 & 50 day moving averages that are acting as a dynamic support levels for Deyaar.
Over all after the results and positive reaction from the market I am bullish on Deyaar stock, if we talk about the price action for now 0.480 is a tuff nut to crack. The same level was previously a support and now it have become a resistance.
Its looking very good for a swing trade from here with a good stop loss area and risk to reward management. Over all the volume is also seen increasing indicating more participants. A small sign of worry is RSI its been try so hard for months but it cannot cross 60 which is bull territory.
I have also posted a short video on my YouTube channel on a trading plan for Deyaar you can have a look here.
If tomorrow market sentiments are positive and no negative news coming out of Russia & Ukraine then we can expect it to cross the resistance with good volumes.
Dont forget to check out the over all DFMGI – video
This is just for educational purpose please do your own research before investing.
All the best!!

should we wait for buy now?
I think deyaar will go very high